
It is often assumed that running an air-to-air unit in cooling mode uses more electricity than running it in heating mode. Here in the UK, most air-to-air heat pumps are installed primarily as “air conditioning”, and sized around the familiar 125 W/m² cooling rule: roughly 1,250 W of cooling capacity for every 10 m² of floor area, with adjustments for glazing, occupancy, etc.
But are cooling loads in the UK really higher than heating loads? Contrary to the prevailing narrative, my measurements suggest they are not, or at least, that it isn’t a simple case of directly comparing cooling to heating loads. Everything below comes from a single air-to-air heat pump I monitor in Surrey, the same unit used for winter heating and summer cooling.
Peak heating and cooling energy usage
The highest-use heating day drew 22.7 kWh of electricity; the highest-use cooling day drew 9.4 kWh.
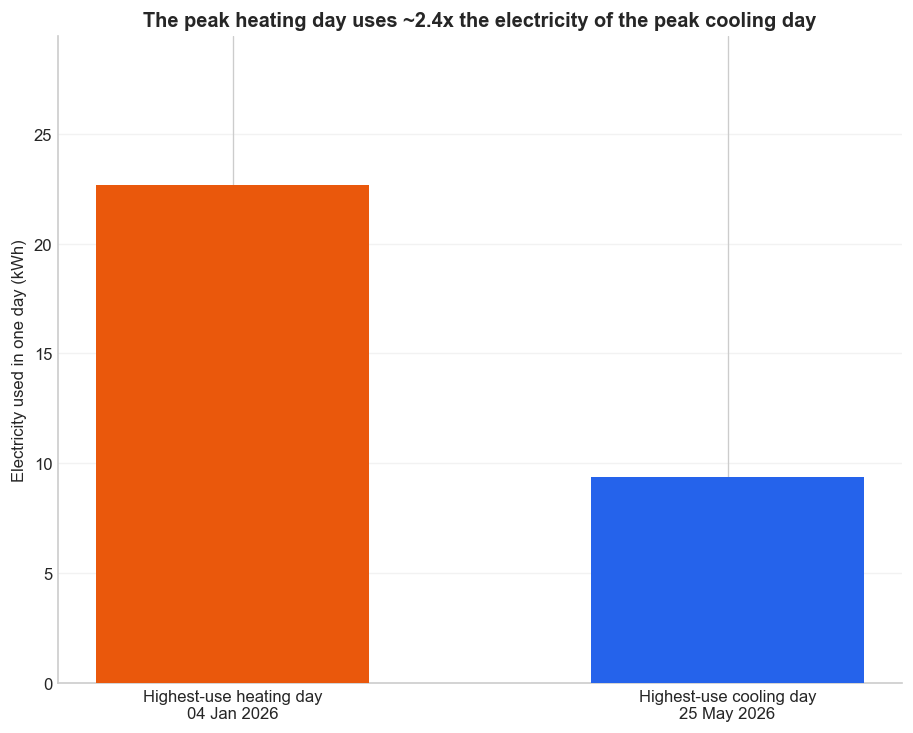
The reason for this difference is relatively straightforward when you think about it. In winter, the outside temperature can sit well below the indoor target for the full 24 hours. So the potential heat loss from the structure over those 24 hours is very high, Summer cooling is different. The hottest part of the day may need active cooling, but UK nights are usually much closer to 21 degrees, with temperatures above 20 degrees being called ‘tropical nights’ and being somewhat uncommon.
Mean hourly electricity usage for heating and cooling
The chart below plots average electricity use by hour of day for the ten hottest and ten coldest days. Cooling clearly rolls on during the day and rolls off overnight, while heating use is much more constant.
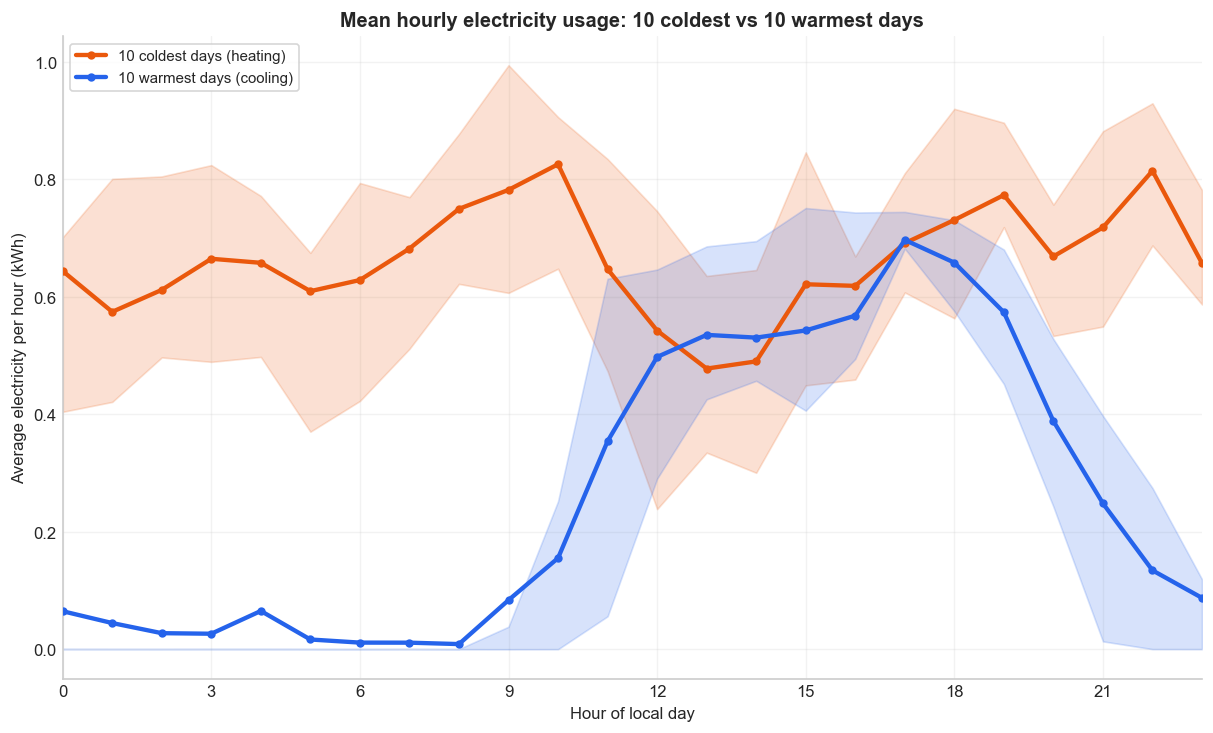
In the cooling season once the room is cool, any overnight heat flux back into it is much smaller, so the load drops away. But additionally, as the outside temperature is relatively close to the target temperature the aircon becomes more efficient, so it can extract more heat for a given unit of energy.
This is not a perfect like-for-like comparison. As the room being monitored is not normally occupied overnight in summer, so the homeowner often turns the unit off at night when cooling. However, in this climate, night-time temperatures often allow that once the room is cool, then it tends to stay cool.
Efficiency: COP for heating was lower than Cooling COP
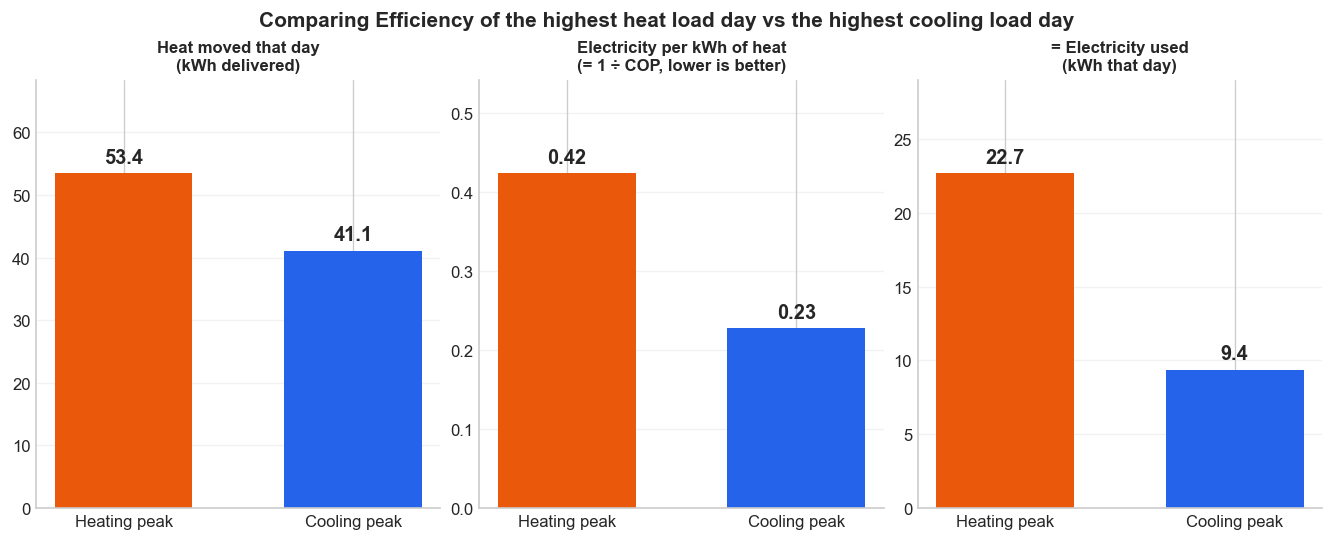
The peak heating day was not just longer; it was also less efficient, according to my measurements, at least.
On 4 January 2026, the unit delivered 53.4 kWh of heat from 22.7 kWh of electricity, a COP of 2.36. On 25 May 2026, it delivered 41.1 kWh of cooling from 9.4 kWh of electricity, a COP of 4.39. Part of the drop in heating efficiency is down to a fault in the Mitsubishi MSZ-LN35VG2 defrost logic, which I won’t go into here.
Put another way, each kWh of heat delivered on the winter peak required 0.42 kWh of electricity, while each kWh of cooling on the summer peak required only 0.23 kWh.
I think the summer efficiency could be improved further still. A temperature sensor on the intake of the external unit suggests it is recirculating a lot of its own exhaust air, which is surprising given that it is not enclosed and sits about a metre and a half above the ground. I think this has implications for air-con installers everywhere.
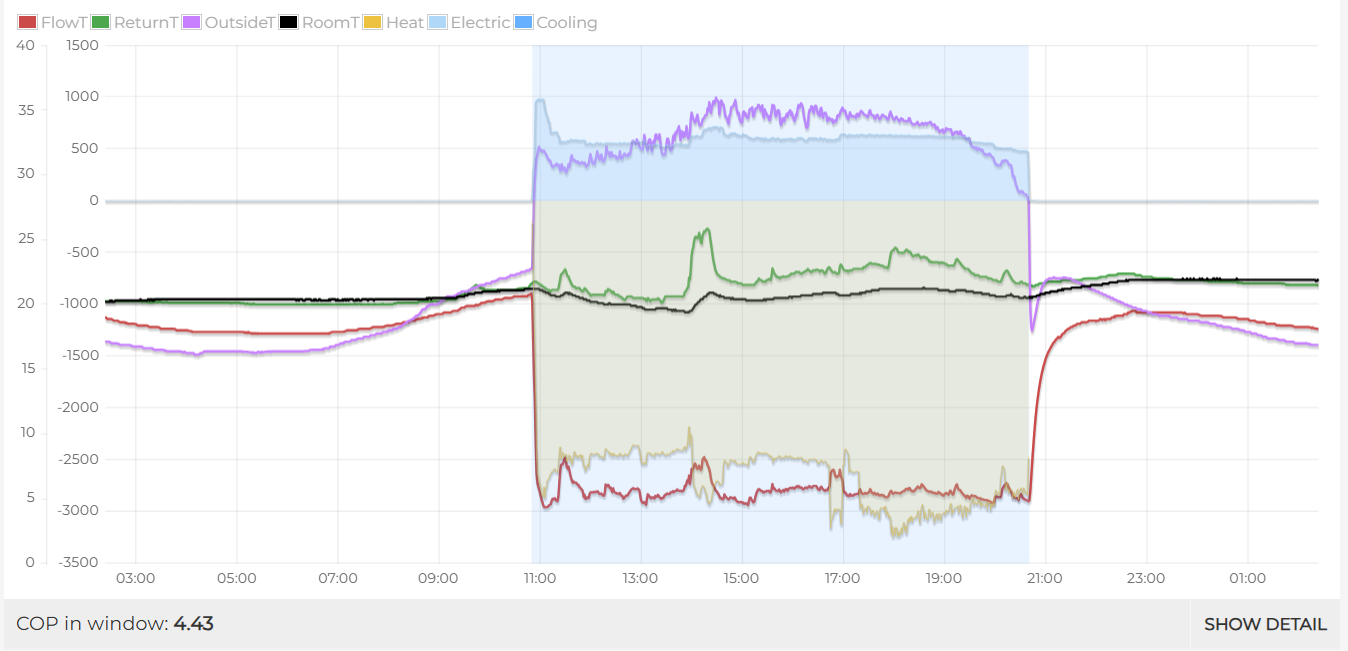
We can see in the above chart how the unit may be recirculating the exhaust air, the outside temperature measurement (currently near the unit intake) ramps up substantially when the unit turns on and falls when it is off.
Degree-hours: Another way to think about load
We can look at energy usage vs temperature another way, using by looking at number of hours where outside temperature deviates from 21°C multiplied by the number of hours it lasts. A 10 °C gap from 21 °C sustained for 12 hours is 120 degree-hours.
On that measure, the peak heating day had around 532 heating degree-hours, while the peak cooling day had around 120 cooling degree-hours. Heating had more than four times the degree-hours of cooling, yet used only about 2.4 times the electricity. Which indicates that cooling loads when compared to heating loads are higher, when we consider the temperature differences.
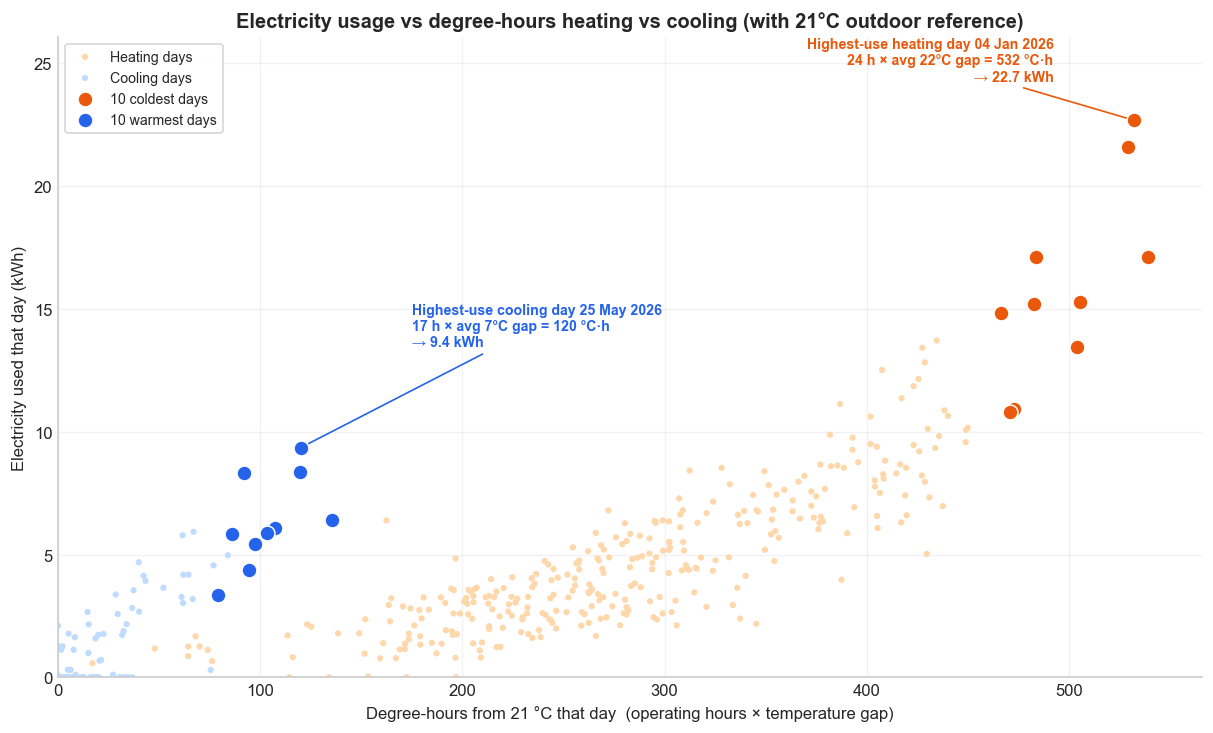
In the above chart the big orange and the big blue dots have the highest and lowest mean temperatures respectively. We can see how cooling load increases with fewer degree hours from 21 than heating load.
It is important to note that degree-hours only count the gap in air temperature, but summer cooling load also has to fight solar gain through glazing and the latent load from humidity, neither of which shows up in outdoor air temperature. However, it does seem like a useful proxy for predicting load, as we know outside temperature in the UK summers strongly aligns with it being sunny.
I will be interested to see how this chart develops as more data accumulates.
Mean outdoor temperature vs electricity use
We can look at this another way. Here, I plot electricity use against mean daily temperature difference from 21 °C, During winter, when the average daily outside temperature is 0 °C, it would read -21°C on this chart, conversely during summer if the mean daily temperature was 25°C it would read as 24°C on the chart.
Remember what I said earlier about the nights being cooler so bringing the summer average temperature down.
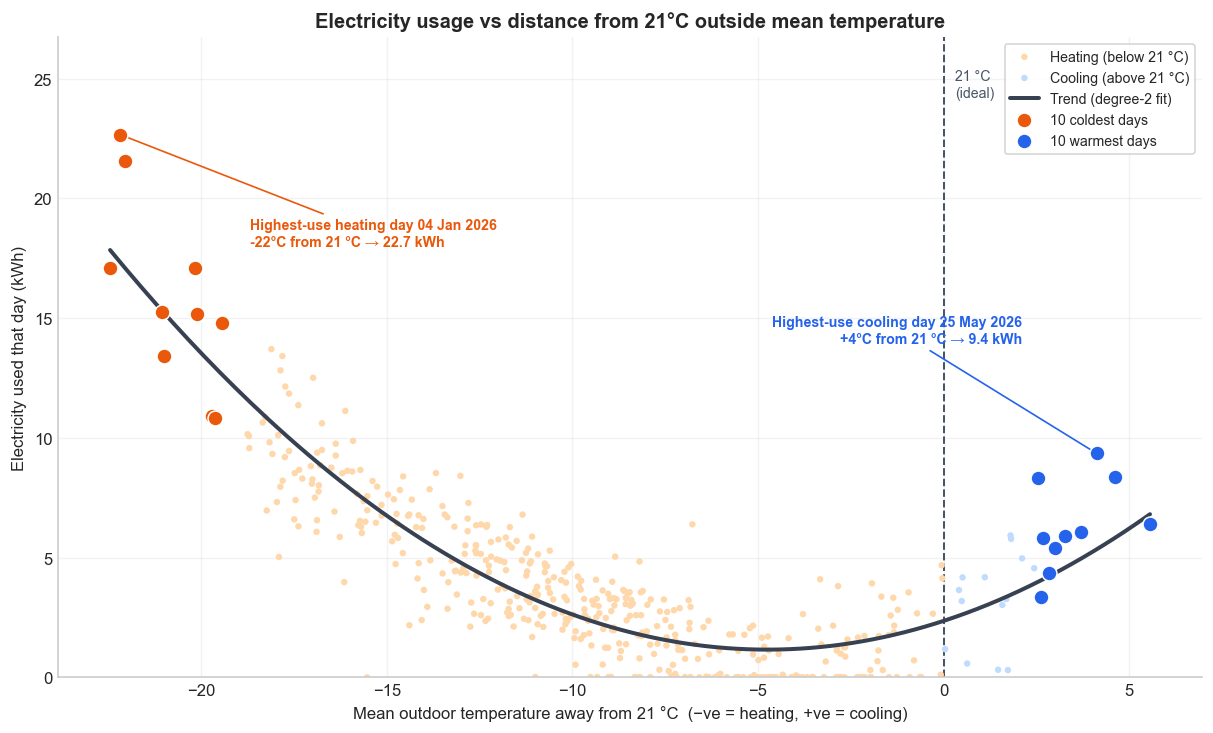
We can see that both heating and cooling appear to follow a parabola of sorts. There is quite a lot of electricity usage near 21 degrees, mean outside temp, which may be a combination of heating and cooling on the same day. I need to check up on that.
In this dataset, the heating side reaches about -22 °C which is significantly below 21 °C reference point.
Conversely the cooling side only, reaches about 6 °C above it. So even though the hottest days feel extreme, they are not as far from the outdoor ‘ideal’ mean temperature as the coldest winter days.
Additionally, while there is very little to no heating load at 5 °C below 21 °C, there is a lot of cooling requirement at 5 °C above average.
Conclusion
For this system, in this house, cooling does not require a higher sustained electricity load, nor does it cost more than heating.
The highest-use heating day used 22.7 kWh of electricity, compared with 9.4 kWh for the highest-use cooling day. The heating day had a larger load, ran for longer, and operated at a lower COP.
That does not mean cooling is trivial. It means the common assumption that “air conditioning requires higher loads than heating” does not hold for this example, but that might change with more data points.