The UK government has announced balcony solar will be legal and available in shops soon, so I thought: is it actually worth it? The only way to really answer that is to look at my historical energy usage and how much the solar panel will generate. Fortunately, this isn’t particularly difficult. But before I do that, I’m going to explain some assumptions I made and a bit more about what balcony solar is.
What balcony solar is
It is a plug-in solar system that can connect to a standard socket without an electrician or grid notification. It is just solar panels connected to an inverter, connected to your plug socket. I’ve heard that it might be limited to around 800W, but this number hasn’t been confirmed. I would have thought it would make sense to limit to a higher figure, such as the peak output of two standard panels, currently around 1000W.
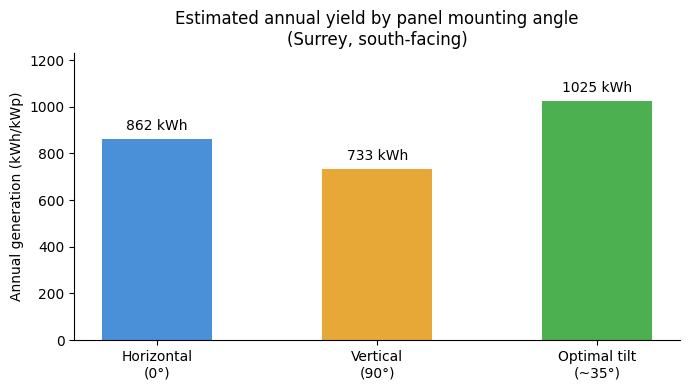
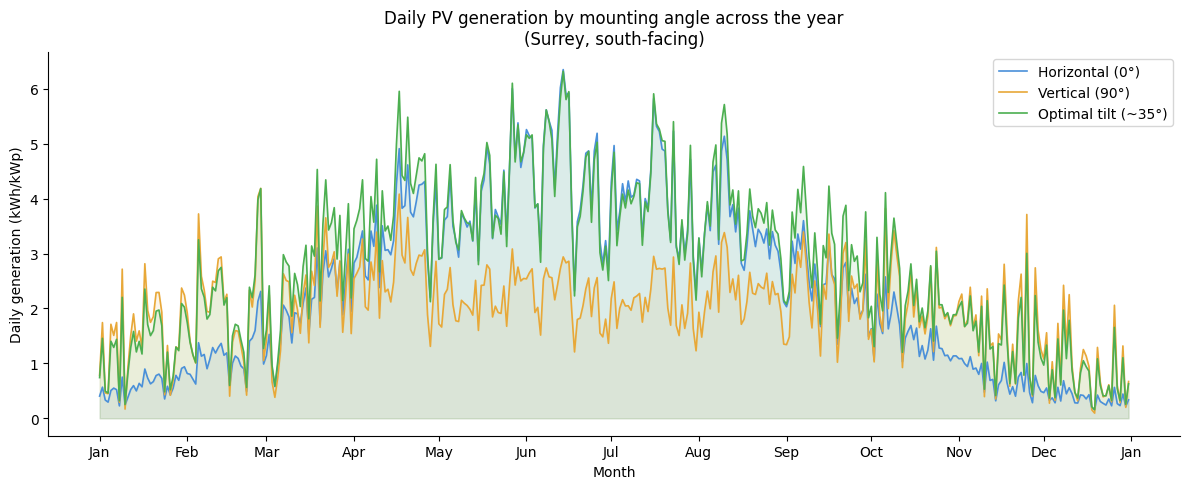
Unlike a rooftop installation, where an installer handles the angle and orientation, balcony solar is largely a DIY decision. You can mount a panel flat, tilted, or vertical – against a fence, on a balcony rail, or fixed to a south-facing wall. The angle matters more than most people expect.
For my location, the optimal tilt is roughly 35° from horizontal, facing due south. A vertical south-facing panel loses about 30% of its annual yield compared to that optimum. A flat horizontal panel loses less.
How you mount yours will depend on your balcony. If you’re mounting on a south-facing balcony rail, vertical is probably your only practical option, and it’s still worth doing. If you have a flat roof or garden, tilt it.
I would mount mine at the optimal 35°.
I’m only looking at facing directly south
The property I am at faces directly south, as does the balcony. Consequently, I’m going to face the solar panels south. If your property faces a different direction, then you would have to consider how that would vary your output.
How the Calculator Works
To work out whether a panel would actually save money, I pulled a full year of half-hourly electricity consumption data from the Octopus API – 17,500 data points covering every 30-minute slot through 2025. I then used PVGIS, the EU’s solar irradiance database, to generate a typical hourly generation profile for my location in Surrey based on 2021–2023 weather data, scaled to 1kWp installed capacity. From what I understand, the peak output of balcony solar is limited to 800 watts, but I don’t know if that is the inverter max or something else. So I have assumed it will be sold with 485W panels, which roughly rounds up to 1kW. So generation might be a bit over, but it’s good enough.
For the calculations, I looked at the electricity consumption for my previous year and the potential solar generation. I ignored batteries and exports, as I wanted to make it as simple as possible. I only offset my true consumption for each half-hour period.
There is no simulated load shifting, no battery, and no export, only self consumption.
My saving from having a 1kW array
Saving = (self-consumed kWh × import rate)
My import rate is 23.35p and is fixed for the next year, so the saving is simply
619.3 kWh x 23.5p
Annual saving: £145.54
Generations and savings by Month
| Month | Consumption (kW) | Generation (kW) | Self Consumed (kW) | Saving (£) |
|---|---|---|---|---|
| January | 176.4 | 41.4 | 30.9 | 7.3 |
| February | 159.9 | 58.1 | 38.6 | 9.1 |
| March | 189.1 | 83.6 | 57.1 | 13.4 |
| April | 137.9 | 119.4 | 55.2 | 13.0 |
| May | 140.7 | 121.6 | 63.7 | 15.0 |
| June | 171.0 | 129.5 | 78.7 | 18.5 |
| July | 139.8 | 122.7 | 60.0 | 14.1 |
| August | 125.2 | 115.0 | 53.4 | 12.5 |
| September | 218.4 | 91.0 | 70.5 | 16.6 |
| October | 210.1 | 72.2 | 50.0 | 11.8 |
| November | 244.5 | 46.3 | 37.9 | 8.9 |
| December | 253.8 | 25.4 | 23.3 | 5.5 |
| Total | 2167.0 | 1026.2 | 619.3 | 145.5 |
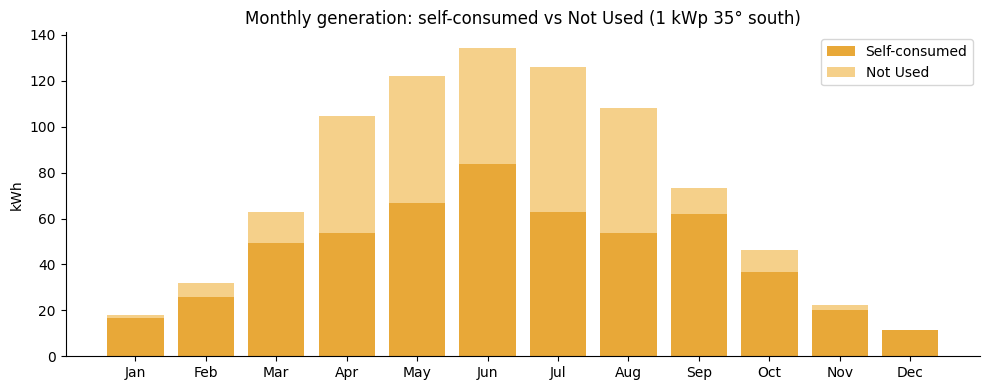
For my usage pattern, a 1kWp south-facing 35° array generates 1026 kWh annually in this location. Of that, roughly 619 kWh gets self-consumed and around 400kWh is wasted. At 23.5p/kWh import and 0p/kWh export, that works out to about £145.5/year in savings.
Payback
A reasonable balcony solar kit — 800W panels and microinverter, are said to cost around £400. At £146/year in savings, the simple payback is just over three years. For a single panel this is quite compelling, particularly since the system requires no maintenance, no installer, and can be taken with you if you move.
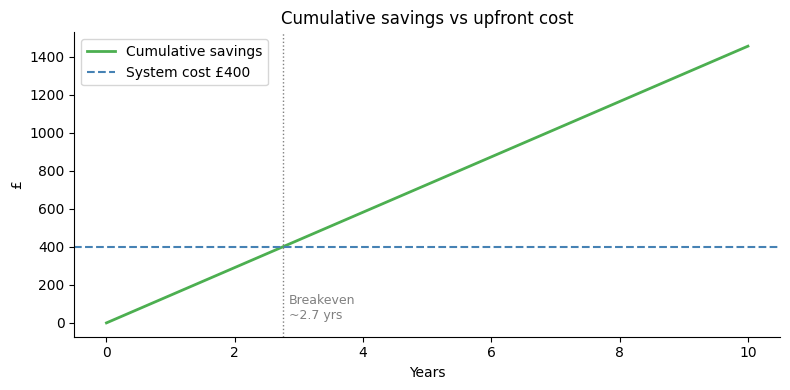
Considering there is no attempt in my usage to load shift towards periods of high solar generation. The payback period Is impressively short. Obviously this would vary depending on what tariff you are on, but considering what could happen to electricity prices this winter, I believe a year long fix with a £25 exit fee, is a good bet.
The broader point here is that balcony solar makes a lot of sense. The payback is potentially very rapid, though this depends how much solar is installed over the coming year and whether or not the grid is oversupplied! Perhaps the payback won’t be very good if everyone gets it.
What If I could use all the energy I generated.
As a thought experiment, it’s worth asking what the numbers look like if I was able to use everything I generated, for a 1kW array it wouldn’t be challenging to self-consume more, by running the washing machine and dishwasher during the day, cooking things in the oven during the day, etc. I wouldn’t be able to use it all, but more of it.
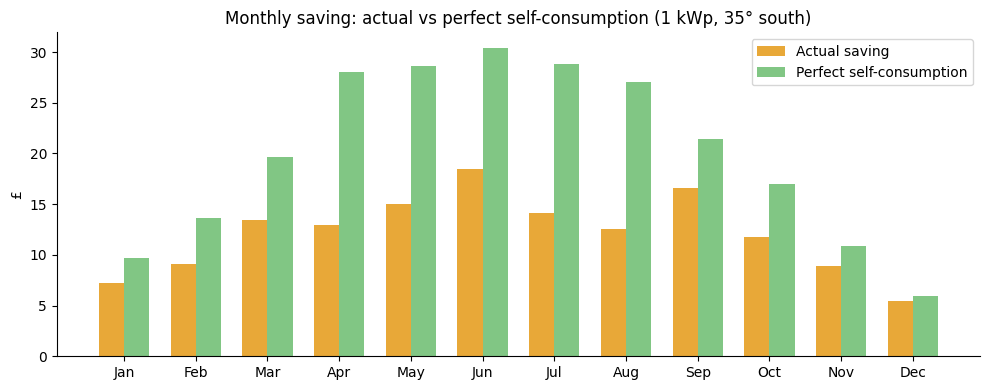
| Month | Generated (kWh) | Self-Consumed (kWh) | Actual Saving (£) | Perfect Saving (£) |
|---|---|---|---|---|
| January | 41.4 | 30.9 | 7.3 | 9.7 |
| February | 58.1 | 38.6 | 9.1 | 13.6 |
| March | 83.6 | 57.1 | 13.4 | 19.6 |
| April | 119.4 | 55.2 | 13.0 | 28.1 |
| May | 121.6 | 63.7 | 15.0 | 28.6 |
| June | 129.5 | 78.7 | 18.5 | 30.4 |
| July | 122.7 | 60.0 | 14.1 | 28.8 |
| August | 115.0 | 53.4 | 12.5 | 27.0 |
| September | 91.0 | 70.5 | 16.6 | 21.4 |
| October | 72.2 | 50.0 | 11.8 | 17.0 |
| November | 46.3 | 37.9 | 8.9 | 10.9 |
| December | 25.4 | 23.3 | 5.5 | 6.0 |
| Total | 1026.2 | 619.3 | 145.5 | 241.2 |
- Actual annual saving: £145.54
- Perfect self-consumption saving: £241.16
- Gap (battery opportunity): £95.62
At 1,026 kWh generated annually, full self-consumption would save around £241/year at 23.5p/kWh. Against the actual figure of £145, that’s a gap of roughly £96. Payback in the theoretical case would drop to under two years.
What about Octopus Agile pricing? (draft) – will check again.
I’ve had a request or two about what would happen if I was on agile and whether vertical solar would make any difference. For AGILE-24-04-03 C (which I believe is London)
This is for a current price cap and historical agile prices, this is a somewhat flawed analysis. I fixed my price this year as I anticipate that prices will rise this winter. If they do then Agile prices will likely rise at times too. So using agile prices from 2025 to 2026 might be misleading.
| Setup | Agile Tariff | Price Cap Tariff |
|---|---|---|
| Total Cost: No solar | £416.59 | £509.24 |
| Savings: Vertical panels | £88.92 | £121.61 |
| Savings: Optimal incline (35°) | £107.77 | £145.54 |
| Total Cost: Vertical panels | £327.67 | £387.63 |
| Total Cost: Optimal incline (35°) | £308.82 | £363.70 |